An Insight into American Football (NFL)

Introduction
American football is one of the most popular sports in the USA and enjoys worldwide popularity. The final game of the National Football League (NFL), the Super Bowl, is one of the biggest sporting events in the world and attracts millions of spectators every year. Due to the high level of interest, it is only natural that data is collected here. The following project includes an explorative analysis of the data set of the NFL Kaggle Competition 2025 as well as a prediction model. This is used to gain a deeper insight into the game.
Motivation
The Super Bowl is a global spectacle that attracts not only fans, but also companies and analysts. Teams invest enormous resources in improving their performance, and data analysis plays a crucial role in this. The question of which factors determine a team's success is therefore of great importance.
American Football
Before we get into the analysis, it is important to understand the basic principles of the game. An NFL game consists of two teams, divided into offence and defence. Each play begins at the line of scrimmage, which shifts after each play. The offence has four attempts (downs) to gain at least 10 yards or score (touchdown or field goal). There are two main plays available:
- Run: The ball carrier tries to gain space by running.
- Pass: The quarterback throws the ball to a team-mate who tries to carry the ball forwards.
The play ends when the team reaches the goal (goal or space gain) or is stopped after the fourth down. If the play is successful, the offence is still in the attacking position, otherwise the offence and defence switch. In critical game situations, strategic decisions are often made, e.g. whether to take a risk or accept a penalty.
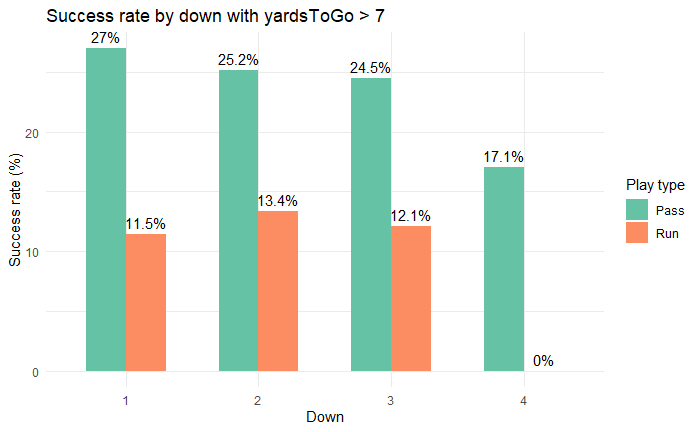
The probability of success increases with increasing downs, which indicates that teams become more willing to take risks the closer they get to a turnover or a new first down. Even though this might seem like trivial finding it helps to understand the players mentality and motivation. The graph on the right also shows that the probability of success is higher when passing. Especially on 4th down where the probability of a run play succeeding is 0%. This would suggest that teams with good pass players are particularly successful.
Prediction Model
Feature Engineering
The data sets ‘plays’ and ‘player_play’ were analysed to create a prediction model. The data was divided into 80% training data and 20% test data. The aim of the random forest model was to determine the predicted ‘yards gained’ in a play.
The model was trained using the ‘randomForest’ package. It is a regression model with a total of 250 decision trees. The sample size is 280,404, with 17 independent variables taken into account. Four randomly selected variables were used for each split (Mtry = 4), and the target node size was set to five. The model uses the impurity approach to determine variable importance and uses the variance rule to split the data.
The following variables were identified as relevant for the first model:
The following variables were identified as relevant for the first model:
- absoluteYardlineNumber: Distance from end zone for possession team (numeric)
- receivingYards: The receiving yards accrued by the player on this play (numeric)
- passingYards : The pass yards accrued by the player on this play (numeric)
- preSnapVisitorScore: Visiting team score prior to the play (numeric)
- preSnapHomeScore: Home score prior to the play (numeric)
- yardsToGo: Distance needed for a first down (numeric)
- down: Down (numeric)
- quarter: Game quarter (numeric)
- rushingYards: The rush yards accrued by the player on this play (numeric)
- isDropback: Boolean indicating whether the QB dropped back, meaning the play resulted in a pass, sack, or scramble (Boolean)
- pff_manZone: Whether the defense employed man or zone coverage on the play (text)
- playAction: Boolean indicating whether there was play-action on the play (Boolean)
- pff_runPassOption: Whether or not the play was a run-pass option (numeric)
- hadDropback: Whether or not the player dropped back on this play (numeric)
- fumbles: The number of fumbles by the player on this play (numeric)
- fumbleLost: Whether or not the player lost a fumble to the opposing team on this play (numeric)
- hadRushAttempt: Whether or not the player had a rushing attempt on this play (numeric)
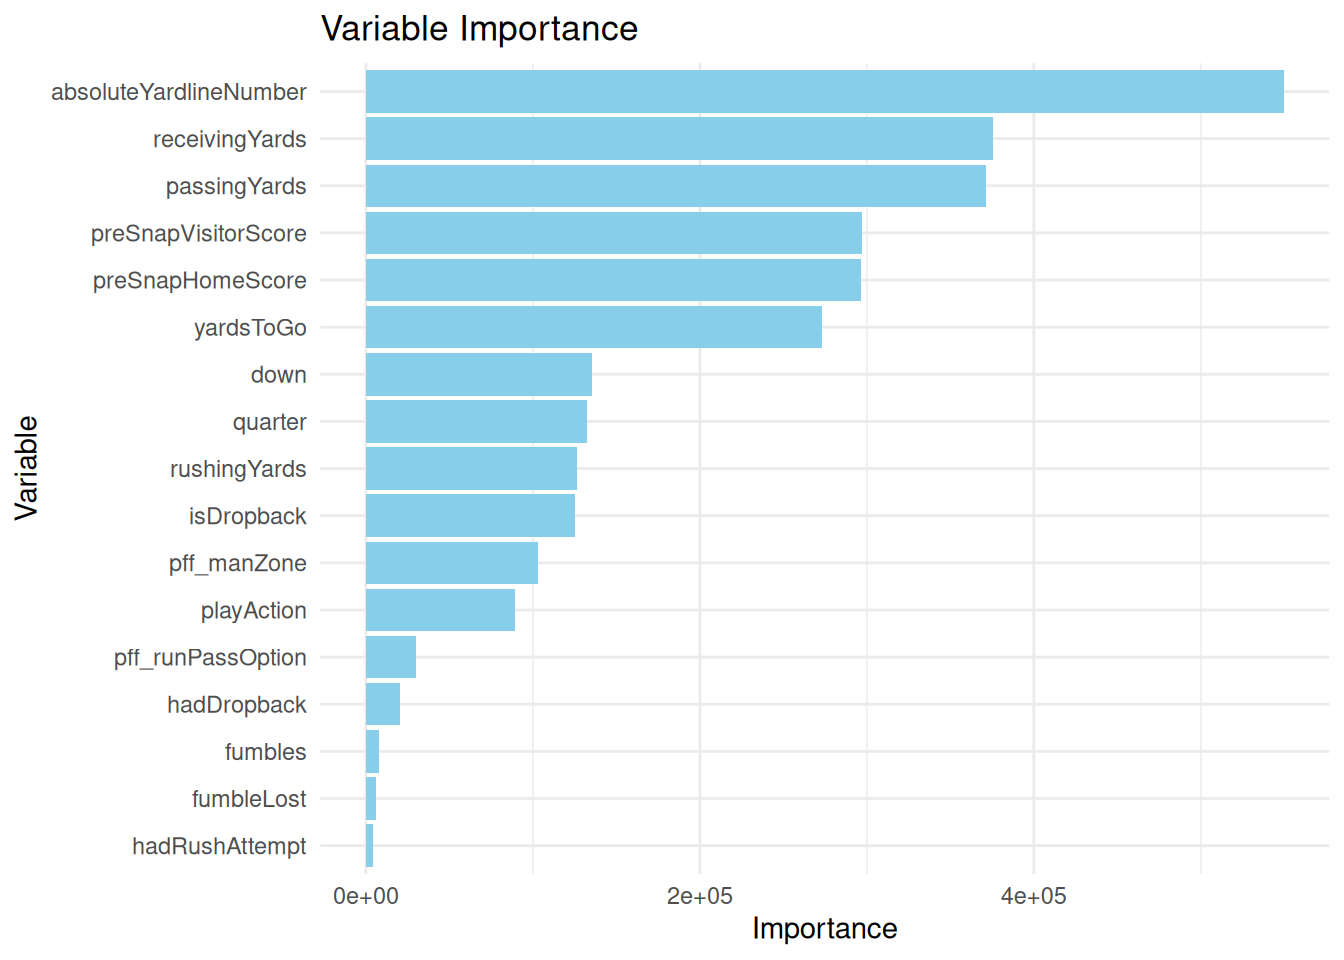
The figure shows the variable Importance and thus the most important influencing variables that lead to the prediction of the model. The features ‘absoluteYardlineNumber’, ‘receivingYards’, ‘passingYards’, ‘preSnapVisitorScore’, ‘preSnapHomeScore’, ‘yardsToGo’ and ‘yardsToGo’ stand out.
Prediction Accuracy
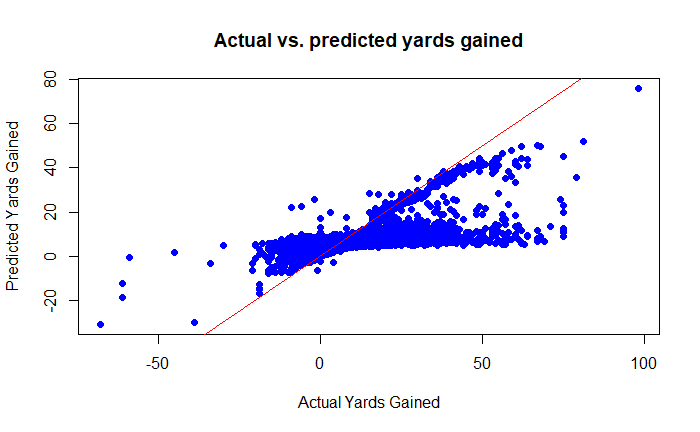
The graph shows that the model's predictions tend to be close to the actual values, but that some systematic errors are recognizable. In particular, the model seems to tend to underestimate higher yardage gains. The R² value of the model is 0.218, which indicates that the model can only explain around 21.8 % of the variance of the dependent variable. This indicates that although the model has a certain predictive power, it still has potential for improvement.
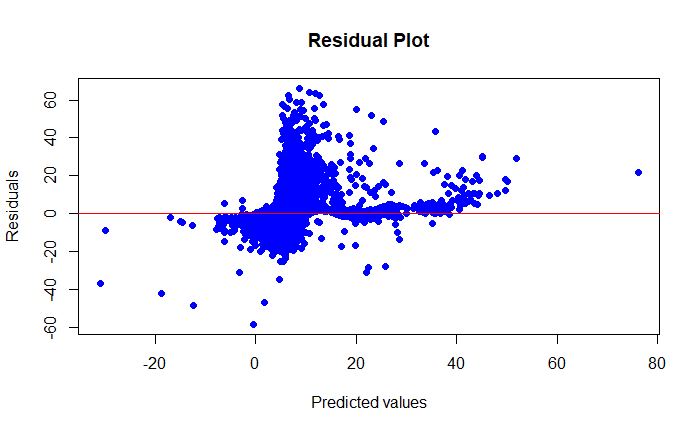
The residual plot shows the difference between the actual and predicted values. An ideal model would have residuals that are randomly distributed around the zero axis. However, the current graph shows patterns that indicate that the model makes systematic errors, especially at higher yardage values. This could indicate unrecognised interactions between the features or insufficient model complexity.
The model for predicting the ‘yards gained’ shows an average deviation between the actual and predicted values. The Mean Squared Error (MSE) of 61.1097 means that the average squared deviation is relatively high, which indicates a certain inaccuracy in the prediction. The Root Mean Squared Error (RMSE) of 7.81727 shows that the model deviates on average by about 7.8 yards from the actual values. This is an indication that the model does capture some trends, but has difficulties with extreme values in particular.
Feature Reduction
For improvement a model with reduced features was created. Only the seven features with the greatest significance were considered (‘absoluteYardlineNumber’, ‘receivingYards’, ‘passingYards’, ‘preSnapVisitorScore’, ‘preSnapHomeScore’, ‘yardsToGo’ and ‘yardsToGo’).
But why are these variables so important in determining the potential of a play? Variables such as the score and the remaining distance to the first down significantly influence the risk a team is willing to take. In addition, absolute position data (e.g. absoluteYardlineNumber) provides valuable information on how teams adapt to the situation.
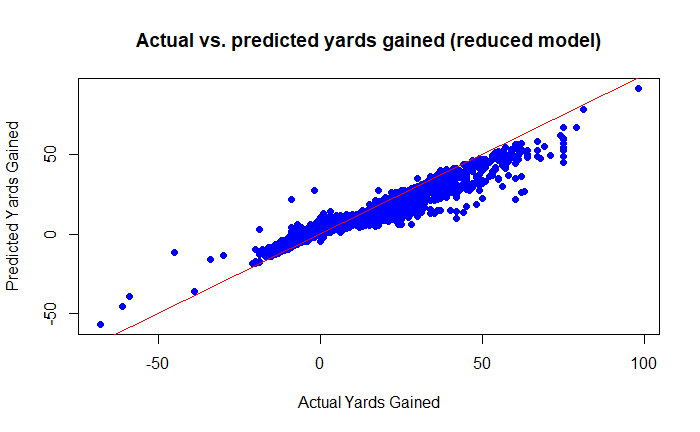
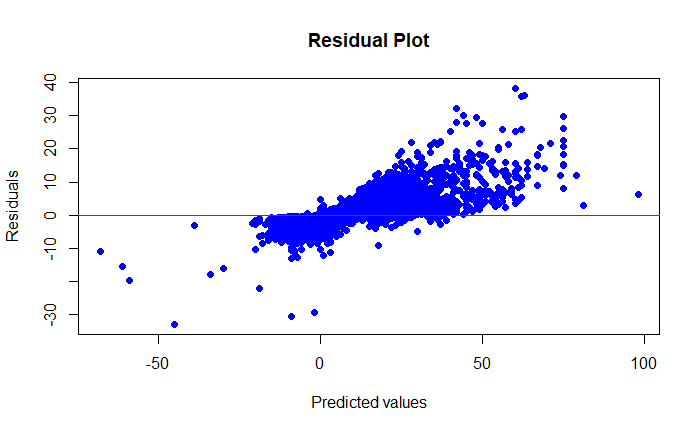
The graph shows that the model's predictions tend to be close to the actual values, with scattering. But the dichotomy shown in the first model has been eliminated. The R² value of the model is 0.7920075, which indicates that the model can explain around 79.2 % of the variance of the dependent variable. This indicates that the model has a certain predictive power.
Model Evaluation
The original model achieved a Mean Squared Error (MSE) of 61.1097 and a Root Mean Squared Error (RMSE) of 7.81727, while the reduced model achieved significantly better values, with an MSE of 33.35745 and an RMSE of 5.775591. These improvements indicate that the reduced model provides higher prediction accuracy and has lower average deviations between predicted and actual yards. A lower RMSE value of the reduced model means that it is able to make more accurate predictions and minimize scatter. This indicates that by eliminating irrelevant features or improving model fitting, performance could be significantly improved.

Conclusion
Analysing NFL data has shown that data-driven approaches can provide valuable insights into teams' strategies for success. Analysing down strategies, yard gains and probabilities of success provides teams with a sound basis for tactical decisions. Future projects could expand on these findings and use innovative analysis methods to optimise game strategies.
The NFL provides its own prediction in the form of Expected Points (EP) in the given data set. The feature Expected Points is calculated based on the average points a team is expected to score from a specific game situation. This is determined using historical data for similar situations, considering factors like down, distance, yard line, and time remaining. During our Project we also looked into improving our model by including Expected Points into our model. This improved our model significantly but defeated the point of the exercise by heavily relying on an already trained model.
